
GeForce RTX 2080
Key Metrics
- Launch Date
- 2018-09-20
- CUDA Cores
- 2,944
- Memory
- 8 GB GDDR6
- Memory Bandwidth
- 448 GB/s
- TDP/TBP
- 225 W
- Interface
- PCIe 3.0 x16
Add to comparison
Save this GPU, then open another GPU page to compare them side by side.
Or compare with:
GPU Gallery

Gaming benchmarks
Test system: AMD Ryzen 7 9800X3D · 32 GB DDR5-6000
1 resolution, 2 result sets · 10 test runs across 10 games
Grouped FPS chart. The vertical scale runs from zero to 50 FPS. 1440p native: median average 41 FPS from 8 distinct games; median 1% low 34 FPS from 8 games; observed average range 21 FPS to 61 FPS. 1440p upscaled: median average 41.5 FPS from 2 distinct games; median 1% low 28.5 FPS from 2 games; observed average range 37 FPS to 46 FPS.
1440p native 8 test runs across 8 games
Row scale: 0 to 80 FPS within this resolution
Average FPS1% low marker
| Game and settings | FPS |
|---|---|
| Assassin's Creed Black Flag Resynced Ultra · Frame gen off · RT off · DLAA |
Average 21 FPS1% low 18 FPS
|
| Crimson Desert Max · Frame gen off |
Average 37 FPS1% low 31 FPS
|
| Death Stranding 2: On the Beach Very high · Frame gen off · RT on |
Average 29 FPS1% low 24 FPS
|
| Horizon Forbidden West Very high · Frame gen off |
Average 49 FPS1% low 40 FPS
|
| Red Dead Redemption 2 Ultra · Frame gen off |
Average 58 FPS1% low 51 FPS
|
| Resident Evil Requiem Max · Frame gen off |
Average 61 FPS1% low 53 FPS
|
| S.T.A.L.K.E.R. 2: Heart of Chornobyl Ultra · Frame gen off · DLAA |
Average 32 FPS1% low 22 FPS
|
| The Last of Us Part II Very high · Frame gen off |
Average 45 FPS1% low 37 FPS
|
1440p upscaled 2 test runs across 2 games
Row scale: 0 to 50 FPS within this resolution
Average FPS1% low marker
| Game and settings | FPS |
|---|---|
| Cyberpunk 2077 Custom · RT on · DLSS |
Average 37 FPS1% low 20 FPS
|
| Forza Horizon 6 Extreme · Frame gen off · DLSS |
Average 46 FPS1% low 37 FPS
|
Each figure is the median across the games listed, one result per game.
GeForce RTX 2050 Max-Q
Laptop GPU
Ampere2021
2,048 CUDA cores · 4 GB GDDR6 · 30 W
GeForce RTX 2050 Mobile
Laptop GPU
Ampere2021
2,048 CUDA cores · 4 GB GDDR6 · 45 W
GeForce RTX 2060
Reference GPU
Turing2019
1,920 CUDA cores · 6 GB GDDR6 · 160 W
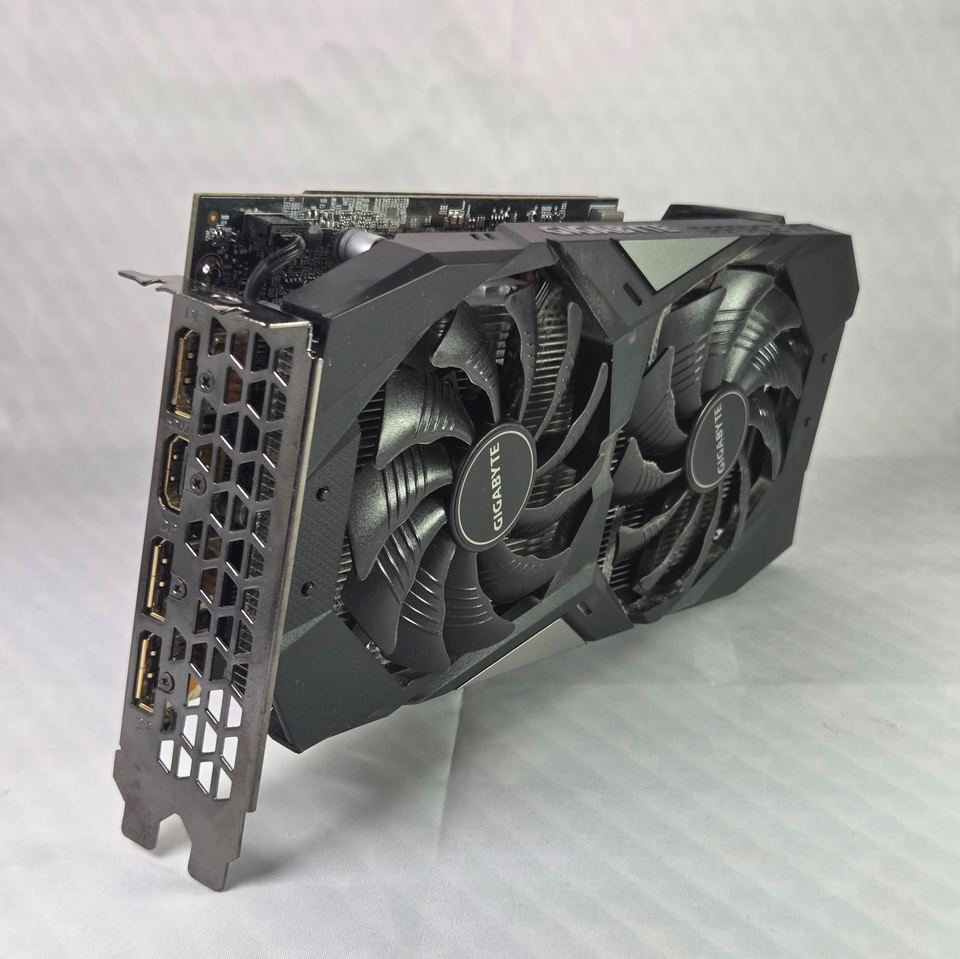
GeForce RTX 2060 12 GB
Reference GPU
Turing2021
2,176 CUDA cores · 12 GB GDDR6 · 185 W
Sources
Primary / manufacturer sources
- NVIDIA GeForce graphics card comparisonOfficial GeForce generation and feature contextOpen source
- NVIDIA GeForce RTX 20 Series comparison specificationsOfficial reference-design memory, interface, graphics-card power, minimum system-power, and supplementary-power specificationsOpen source
- NVIDIA introduces GeForce RTXOfficial September 20, 2018 availability for RTX 2080 Ti and RTX 2080Open source
Independent reference sources
- TechPowerUp GPU SpecsModel-level specification reference for this GPU entryOpen source
Reference databases
- RightNow GPU DatabaseOpen GPU database used to cross-check specifications A reference database: good for cross-checking specifications, but not proof of the original release details on its own.Open source
Photo sources
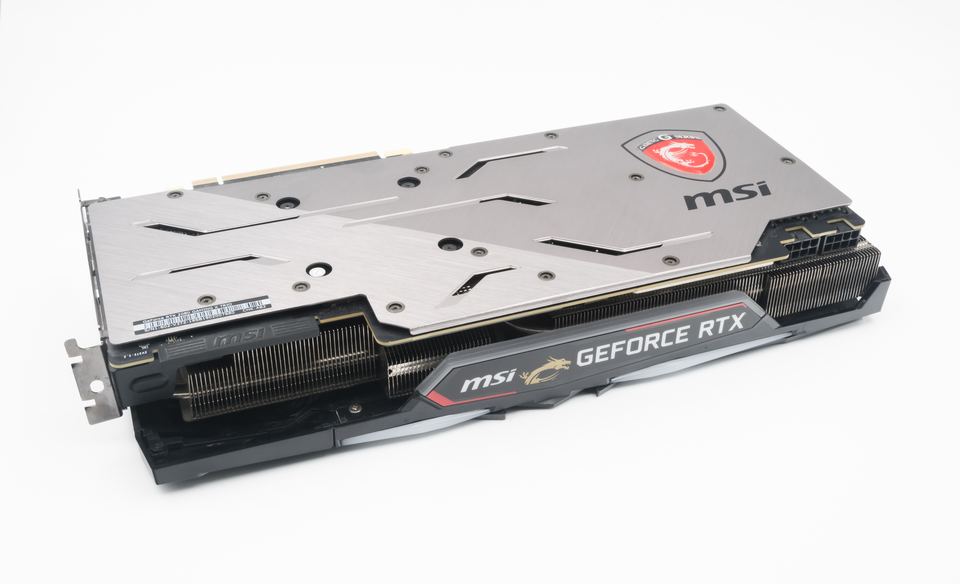
- Wikimedia CommonsPhoto: MSI GeForce RTX 2080 Gaming X Trio board (Rear)Creator: Jacek HalickiCredit: Jacek Halicki / Wikimedia CommonsTitle: 2023 MSI GeForce RTX 2080 Gaming X Trio (1)License: CC BY-SA 4.0 InternationalSource claim: Commons credits Jacek Halicki and states this exact photograph is CC BY-SA 4.0 International.Modified: Resized to 960 px maximum dimension and JPEG recompressed; no local crop. CC BY-SA 4.0 International terms retained.Board identity: The exact Commons file page identifies this representative board.Configuration: This rear view shows the MSI Gaming X Trio backplate and cooler edge. The photo does not independently establish the Wiki 8 GB GDDR6 configuration or reference clocks.License deedOriginal file page